DMM Data Logger - Documentation
1)Installation
Unzip the zip file into your favorite location.
DMM Data Logger is a portable application.
The same procedure is valid for both Windows and Linux Versions.
2)Usage:
If you are going to use the Mastech MS8229 multimeter please follow this tutorial for the hardware hack.
In order to get the communication port do like this :
Connect your multimeter into your computer using a Serial to USB cable.
Make sure that the serial cable is recognized by your system.
In Linux use these commands via konsole :
lsusb
dmesg
sudo chmod a+rw /dev/ttyUSB0
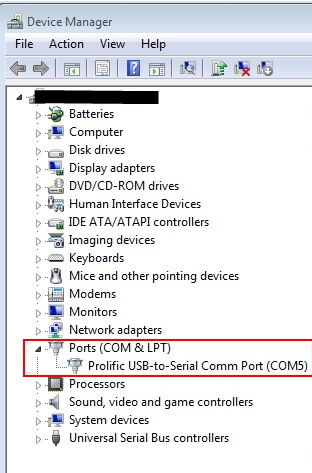
In Windows go to
Start->Control Panel->System->Device Manager->Ports
and find your COM port used by the serial cable.

Now fill the "Interface port" (/dev/ttyUSB0 or COM1 for example)
Refresh every : 100 ms
Display font size : 12 px
Set unit vale : AUTO
Select enable logging and enable graph
Autosave every 100 ms
Switch on your multimeter and make sure you have enabled the RS232 option.
Now press the "Connect" button.
If you get an invalid code disconnect and reconnect.
Once connected press the "Graph" button in order to plot the real time graph.
3)Reference :
Interface port : In which serial port the multimeter is connected (/dev/ttyUSB0 or COM1 for example)
Refresh every : Every how many milliseconds DDM Data Logger tries to read the multimeter output stream. Display font size : How big the digits should be.
Set unit value : Use "AUTO" in order to parse the value (Ohm/V/A) directly from the multimeter. Mastech MS8229 does not stream out the Celsius / Fahrenheit / Db / Lux so you have to add them manually.
Enable logging : generates CSV files. The Comma-Separated-Values files can be opened in Excel/Open-LibreOffice
Enable graph : plots a real time graph.
Ouput path : the path where CSV and BMP files are saved.
These files have file names with this format :
YYYY-MM-DD-HH-MM-SS
Example : 2012-10-06-12-52-53.cvs
Autosave every : flush the listview every X entries. These entries are saved into the CSV file.
The graph window :
In X axes are the timestamps.
In Y axes are the parsed values (Volts/Amperes etc...)
Max number of X records : the maximum values that can be showed in the graph. This value can be changed at runtime.
Autoscale Y : autoscale the Y range of the graph.
If you want to "zoom" into a certain range then disable autoscale and use the MinY/MaxY values.
Ex : If you have an output voltage toggling between 10-11V then use MinY 10 and MaxY 11.
Notice that both MinY/MaxY can have negative values.
You can plot the graph as Bar or Line
Pen width : set the thickness of the pen in order to plot the graph.
Save the bitmap : save the current graph into bpm.
The bitmap is stored in the output path setted from the settings.
Video presentation :